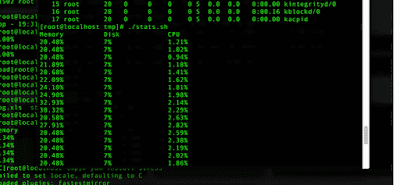
1>Run your program in linux in jboss
2>Goto jboss or weblogic bin
3>Search your program running or not using below command
4>ps -ef | grep -sps
5>Get PID from linux after search
6>Check the cpu utilization using below any one command
7>vmstat 1
8>top -p 123456 H
where 123456 is pid of this component
9>Now look into the command prompt and see the "id" column in command prompt if it near to 100 then cpu ideal time is good
10>Now take the thread dump below command
11>goto /opt/ctier folder
using cd
12>using like: /opt/ctier/softwares/jdk1.8.0_05/bin/jstack -l 20563 > log.txt
where 20563 is pid in side jdk1.8.0_05 and log.txt is the thread dump file.
13>Copy this file from root folder from /opt/ctier/log.txt
14>open this file and see the log
or
15>open this url http://fastthread.io
16>upload log.txt file
17>see the result
18>Done
If you find this post helpful, I would really appreciate if you can share it with your friends. Also you can check more questions and analysis here.
