Introduction
As the name suggests, Garbage Collection refers to removing of objects which are no longer in use. It is a well known fact that irrespective of their scope objects, Java stores objects in heap. Thus, if we keep on creating objects without clearing the heap, our computers might run out of heap space and we get ‘Out of Memory’ error. Garbage Collection in Java is a mechanism which is controlled and executed by the Java Virtual Machine (JVM) to release the heap space occupied by the objects which are no more in use. In contrast to C++, garbage collection in java relives the developer from the Memory Management related activities. The JVM executes this process with the help of a demon thread called the ‘Garbage Collector’. The garbage collector thread first invokes the finalize method of the object. This performs the cleanup activity on the said object. As a developer we cannot force the JVM to run the garbage collector thread. Though there are methods e.g Runtime.gc () or System.gc(), but none of these assures the execution of garbage collector thread. These methods are used to send garbage collection requests to the JVM. It is up to the Java Virtual machine when it will initiate the garbage collection process.


Heap Generation for Garbage Collection
For the sake of Garbage Collection in Java, Heap memory is divided into three parts :
- Young Generation
- Tenured or Old Generation
- Permanent Generation
Young Generation is further divided into three parts known namely Eden space, Survivor 1 and Survivor 2 space. A live object resides in Eden space and after a Minor Garbage collection if the object is still live it is moved into survivor 1 and subsequently to survivor 2. Finally after the Major Garbage collection the object is moved to Old or tenured generation.
How to take the Decision of one step to another moved?
Explain:
If you think that your total heap memory is 10 GB and you division into three parts: So each part have some memory space like 1:1:1 formula. So Eden space have 3.33GB space is there. Now Eden space divided into three parts
like
a>Eden
b>Survivor 1
c>Survivor 2(Space)
now think that there have also memory is 1:1:1. So now 3.33 GB convert to 1.11 GB for each.
Algorithms of garbage collection:
- Most of the newly created objects are located in the Eden memory space.
- When Eden space is filled with objects, Minor GC is performed and all the survivor objects are moved to one of the survivor spaces. because JVM internal execute the iteration of each object, so each object increment the age after one process complete
- Minor GC also checks the survivor objects(old object who stay in long term in Eden space) and move them to the other survivor space. So at a time, one of the survivor space is always empty.
- Objects that are survived after many cycles of GC, are moved to the Old generation memory space. Usually it’s done by setting a threshold for the age of the young generation objects before they become eligible to promote to Old generation.

Example:
So now you think that your Young space is 1.11GB
So if any new object came that time insert to Young space but that time call to mark_sweep() method because you can rectified or mark which object age or iteration cycle is higher. if it is exceed the configuration cycle then it automatically go to survivor 1 state. if not exceed cycle but object came many then process manager manage to who is older age moved to Survivor 1 space this is same Technic of all other partition. So flow this rule and you got your threshold or efficiency of you pc memory.(N B: when insert any new object please use the mark_sweep() method and inside this method mark find out which is no need for farther and which is need for longer, So if no need longer call to sweep method other wise check the age of object if age is much exceed the limit of staying time in a particular place then moved to different place)
How You will see the result?
Command used by me to start the demo application is:mandalkc@mandalkc:~/MandalKC/Java/jdk1.7.0_71/demo/Test$ java -Xmx120m -Xms30m -Xmn10m -XX:PermSize=20m -XX:MaxPermSize=20m -XX:+UseSerialGC -jar Test.jar
jsat
We can use jstat command line tool to monitor the JVM memory and garbage collection activities. It ships with standard JDK, so you don’t need to do anything else to get it.
For executing jstat you need to know the process id of the application, you can get it easily using ps -eaf | grep java command.
mandalkc@mandalkc:~$ ps -eaf | grep Test.jar
501 9582 11579 0 9:48PM ttys000 0:21.66 /usr/bin/java -Xmx120m -Xms30m -Xmn10m -XX:PermSize=20m -XX:MaxPermSize=20m -XX:+UseG1GC -jar Test.jar
501 14073 14045 0 9:48PM ttys002 0:00.00 grep Test.jar
So the process id for my java application is 9582. Now we can run jstat command as shown below.
mandalkc@mandalkc:~$ jstat -gc 9582 1000
S0C S1C S0U S1U EC EU OC OU PC PU YGC YGCT FGC FGCT GCT
1024.0 1024.0 0.0 0.0 8192.0 7933.3 42108.0 23401.3 20480.0 19990.9 157 0.274 40 1.381 1.654
1024.0 1024.0 0.0 0.0 8192.0 8026.5 42108.0 23401.3 20480.0 19990.9 157 0.274 40 1.381 1.654
1024.0 1024.0 0.0 0.0 8192.0 8030.0 42108.0 23401.3 20480.0 19990.9 157 0.274 40 1.381 1.654
1024.0 1024.0 0.0 0.0 8192.0 8122.2 42108.0 23401.3 20480.0 19990.9 157 0.274 40 1.381 1.654
1024.0 1024.0 0.0 0.0 8192.0 8171.2 42108.0 23401.3 20480.0 19990.9 157 0.274 40 1.381 1.654
1024.0 1024.0 48.7 0.0 8192.0 106.7 42108.0 23401.3 20480.0 19990.9 158 0.275 40 1.381 1.656
1024.0 1024.0 48.7 0.0 8192.0 145.8 42108.0 23401.3 20480.0 19990.9 158 0.275 40 1.381 1.656
The last argument for jstat is the time interval between each output, so it will print memory and garbage collection data every 1 second.
Let’s go through each of the columns one by one.
S0C and S1C: This column shows the current size of the Survivor0 and Survivor1 areas in KB.
S0U and S1U: This column shows the current usage of the Survivor0 and Survivor1 areas in KB. Notice that one of the survivor areas are empty all the time.
EC and EU: These columns show the current size and usage of Eden space in KB. Note that EU size is increasing and as soon as it crosses the EC, Minor GC is called and EU size is decreased.
OC and OU: These columns show the current size and current usage of Old generation in KB.
PC and PU: These columns show the current size and current usage of Perm Gen in KB.
YGC and YGCT: YGC column displays the number of GC event occurred in young generation. YGCT column displays the accumulated time for GC operations for Young generation. Notice that both of them are increased in the same row where EU value is dropped because of minor GC.
FGC and FGCT: FGC column displays the number of Full GC event occurred. FGCT column displays the accumulated time for Full GC operations. Notice that Full GC time is too high when compared to young generation GC timings.
GCT: This column displays the total accumulated time for GC operations. Notice that it’s sum of YGCT and FGCT column values.
The advantage of jstat is that it can be executed in remote servers too where we don’t have GUI. Notice that sum of S0C, S1C and EC is 10m as specified through -Xmn10m JVM option.

Full GC and Concurrent GC
In java, Concurrent garbage collector uses a single GC thread that runs in tandem with the application threads. This has a goal to complete the collection of the tenured generation before it becomes full. If the concurrent garbage collector is still running and the tenured generation heap is full, the application is halted and the collection is completed with all the application threads stopped. This garbage collection is referred to as full Garbage Collection
Eligibility
An object becomes eligible to be garbage collected if its references are nullified. In other words an object is picked by the garbage collector if it cannot be reached by any live thread or it does not have any static reference. If two objects have cyclic dependency and none of them are referenced by any other live threads then both of these objects are eligible for garbage collection. In Java, an object becomes eligible for garbage collection under the following circumstances:
- When the reference to the said object is nullified or set to null explicitly.
- When the control moves out of the block which creates the object.
- When an object holding the reference of another object is set to null, then both the objects - child and parent are eligible for garbage collection.
The Algorithm
The garbage collection algorithm performs the following two basic tasks:
- It first checks whether the objects is eligible or not to be garbage collected.
- Once the object is identified, the garbage collector reclaims the heap space used by the object and makes the space available back to the program.
Detection of the eligible object is done by defining a set of roots and tracing the reachability from the roots. An object is said to be reachable if there exists a path of reference from the roots using which the executing program can access the object. These roots once defined are accessible to the executing program. An object which is reachable from any of these roots is considered to be "live." Objects that are not reachable by the defined roots are considered to be garbage, as they cannot put any impact on the execution of the program further. In addition to this, an object which is referred by a live object is also considered as reachable. These reachable objects are accessible by the executing program; hence, these objects should remain on the heap as long as they are required. An object which is not reachable can be garbage collected since there is no way a program can access it.
So the available System.gc() method can be used to request garbage collection. And the System.runFinalization() method is used to run finalizers for all the eligible objects for GC.
Listing 1: The sample describes the syntax for calling garbage collection and finalizer
static void gc() // Requests GC to run
static void runFinalization() // Requests finalizers to run
Listing 2: Sample program performs garbage collection. The free memory before and after garbage collection is returned and displayed.
import java.util.*;

class GarbageCollectionDemo
{
   public static void main(String s[]) throws Exception
   {
      // Get runtime environment
Runtime rt =  Runtime.getRuntime();
System.out.println("Free memory before Garbage Collection = "+rt.freeMemory());

      // Apply garbage collection
       rt.gc();
System.out.println("Free memory after Garbage Collection = "+rt.freeMemory());
   }
}
The following diagram describes the garbage collection model in java.

Figure 1: Garbage Collection Model in Java
How to Send message to end user that your running program Give out of memory error.
Encountering an OutOfMemoryError means that the garbage collector has already tried its best to free memory by reclaiming space from any objects that are no longer strongly referenced. If it could not reclaim enough space, then it also tried to obtain memory from the underlying operating system, unless heap space is already at the JVM upper memory bound set by the -Xmx parameter (-mx in JVMs prior to Java 2). So encountering theOutOfMemoryError means that there is no more heap space that can currently be reclaimed, and that either the operating system cannot provide any more memory to the JVM or you have reached the JVM upper memory bound. In any case, there is not much you can do, so when would you ever want to catch an OutOfMemoryError?
The following sections describe a few special situations when it can be useful to catch an OutOfMemoryError.
Expanding Memory and Determining Memory Limits this two feature we need OutOfMemoryError in try catch block.
package com.kartik.error;
/**
*
* @author Kartik Chandra Mandal
* How to handle run time exception in Java file
*/
public class RunTimeMemoryException {
private static final int MEGABYTE = (1024*1024);
public static void runOutOfMemoryError() throws Exception{
MemoryMXBean memoryBean = ManagementFactory.getMemoryMXBean();
try {
long data[] = new long[1000000000];
}
catch (Exception e) {
throw new Exception("Out of memory error e");
}catch (OutOfMemoryError e) {
MemoryUsage heapUsage = memoryBean.getHeapMemoryUsage();
long maxMemory = heapUsage.getMax() / MEGABYTE;
long usedMemory = heapUsage.getUsed() / MEGABYTE;
System.out.println( "Memory Use :" + usedMemory + "M/" + maxMemory + "M");
throw new Exception("Out of memory error by Kartik");
}
}
public static void main(String[] args) {
try {
runOutOfMemoryError();
} catch (Exception e) {
System.out.println(e.getMessage());
e.printStackTrace();
}
}
}
Out Put:
Memory Use :1M/882M
Out of memory error by Kartik
java.lang.Exception: Out of memory error by Kartik
at com.demo.RunTimeMemoryException.runOutOfMemoryError(RunTimeMemoryException.java:21)
at com.demo.RunTimeMemoryException.main(RunTimeMemoryException.java:28)
2) Each Thread in Java has there own stack which can be specified using -Xss JVM parameter, similarly you can also specify heap size of Java program using JVM option -Xms and -Xmx where -Xms is starting size of heap and -Xmx is maximum size of java heap. to learn more about JVM options see my post 10 JVM option Java programmer should know.
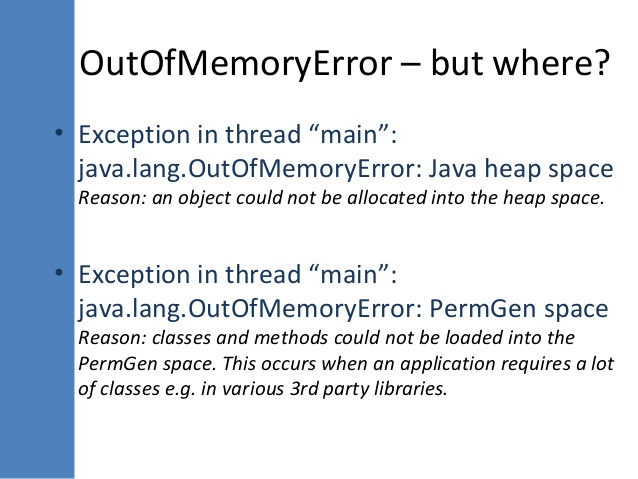
3) If there is no memory left in stack for storing function call or local variable, JVM will throw java.lang.StackOverFlowError, while if there is no more heap space for creating object, JVM will throw java.lang.OutOfMemoryError: Java Heap Space. Read more about how to deal with java.lang.OutOfMemoryError in my post 2 ways to solve OutOfMemoryError in Java.
4) If you are using Recursion, on which method calls itself, You can quickly fill up stack memory. Another difference between stack and heap is that size of stack memory is lot lesser than size of heap memory in Java.
5) Variables stored in stacks are only visible to the owner Thread, while objects created in heap are visible to all thread. In other words stack memory is kind of private memory of Java Threads, while heap memory is shared among all threads.
I am Kartik Chandra Mandal from Bangalore, India. Working as software engineer in Java technology. Have good knowledge of OWASP and CSRF in security for applications and it's implementation in Java technology.
1 comments:
Click here for commentsnice topic and nice explanation